Question for you – How are your accounts payable processes really performing?
That’s a tricky question to answer if you don’t have easy access to your data.
Reporting dashboards provide exactly that, making them a fan-favorite feature of AP automation platforms like OnBase among AP professionals. These tools offer you full visibility into your organization’s cash flow and overall financial health, displaying key financial and operational data.
This way, you can discover and address process bottlenecks in real time. Whether you’re looking to make the most of your existing OnBase solution or are simply curious about this tool, here are the top 5 reporting dashboards for AP benefits you need to know about.
5 Ways Accounts Payable Can Make the Most of Reporting Dashboards
1. Retrieve Accurate, Up-to-Date AP Data
With reporting dashboards, you can see your business data represented in easy-to-understand graphs. This interactive format lets you monitor performance analytics and understand how they relate to other meaningful data. Reporting dashboards conveniently display financial and operational data like:
- The average time taken for invoice approval and payment
- Invoice processing metrics like the number of invoices received, processed, and pending.
- Analyze vendor payment history and identify trends
- Track changes to invoices, approvals, and payment details for auditing purposes to ensure adherence to compliance standards.
- Monitor vendor compliance with payment terms
- Processing, approval, and payment costs
- Error rates, which you can monitor to identify common errors
- Trends
These are the insights you need to make more informed decisions quickly, like predicting resource availability, prioritizing bill payments, removing compliance obstacles before an audit, or optimizing processes. You can even create moment-in-time snapshots of data to use for historical purposes.
2. Continuous, Real-Time Visibility into Each Stage of the Invoice Lifecycle
Reporting dashboards graph real-time data and KPIs from your OnBase accounts payable system to give you full visibility into every step of the payment process. This way, you can scout out potential liabilities and make more accurate cash flow predictions. Having these insights helps you make decisions, monitor cash flow, and manage your budget. Your vendors will be happier, too. For example, if a vendor calls asking about an invoice’s progress, you can easily determine where it is in the process and answer their questions.
The system can also automatically highlight invoices approaching their due dates so you can monitor them to ensure everything is paid for on time. And as you pay more invoices ahead of time and begin taking advantage of early payment discounts, you can use reporting dashboards to track them and evaluate their impact on cash flow. Still, if you do end up with a late invoice here and there, your dashboards can display late fees in a single location, so you don’t have to hunt them down and worry you might be missing one.
Get a Closer Look into Reporting Dashboards
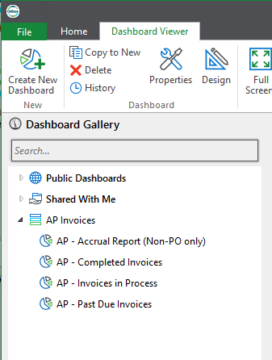
View Your Saved Dashboards on the Dashboard Viewer
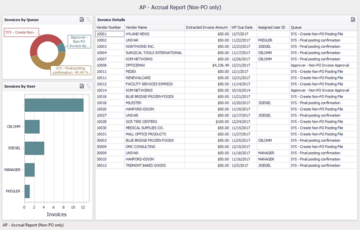
View Invoices By Queue to Track Where They Are in the Process
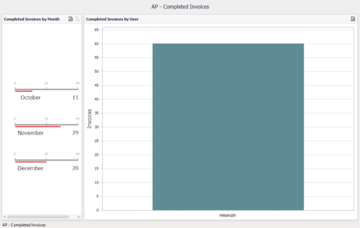
Completed Invoices View
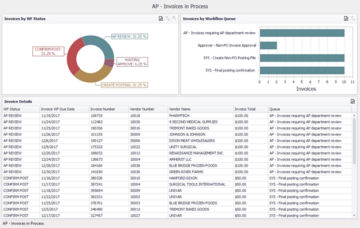
Invoices in Process View
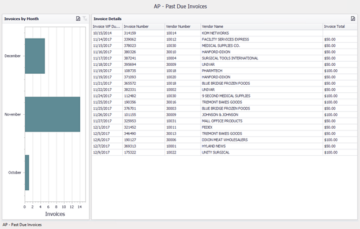
Past Due Invoices View
3. Build Your Own Customized View
Your individual dashboard view can be customized to support different roles, so they display the information that’s most relevant to each user. Dashboards can also be shared among teams, departments, or your entire organization.
For example, here’s what a CFO, controller, and AP manager might prioritize on their dashboard views:
- CFO:
- Invoices that are authorized for payment
- Invoices that have been created
- Amount of open invoices
- Controller:
- Canceled invoices, by vendor
- Invoices waiting for approval, by user
- Invoice lifecycle metrics
- AP Manager:
- Approval time trends
- Days pending routing and approval
- Number of invoices that have been routed, by user
4. Handle Exceptions More Effectively
Another useful application of reporting dashboards lies within exception handling. You can create dashboards to track and manage exceptions, like invoices requiring additional approvals or corrections. Then, you can use this view to monitor the resolution time for exceptions to determine which ones occur the most frequently and other trends. These insights can also help you pinpoint ways to improve overall process efficiency.
5. Reveal Bottlenecks with Productivity & Process Insights
Along with being able to track metrics related to invoice payment and approval times, OnBase accounts payable reporting dashboards also let account managers track employee workload-focused metrics. Specifically, simple bar graphs let you track employee workloads. You can even filter by department or company using checkboxes.
You can then use this information to identify productivity lags caused by overbooked teams and balance their workloads appropriately. These insights can also help you identify and mitigate bottlenecks in the approval workflow and elsewhere to improve processing efficiency and resource management.
How to Use Reporting Dashboards
Turn Accounts Payable into a Strategic Driver With OnBase Accounts Payable Reporting Dashboards
With their virtually limitless capabilities and customization options, you have the opportunity to make reporting dashboards truly work for you. Whether you’re looking to optimize your processes, make more informed decisions, or ensure greater transparency and control over your AP process, reporting dashboards can deliver.
Want to learn more about reporting dashboards and AP automation more broadly? Drop a comment or question in the chat below, we’d love to hear from you.
Want More Content Like This?
Subscribe to the Naviant Blog. Each Thursday, we’ll send you a recap of our latest info-packed blog so you can be among the first to access the latest trends and expert tips on workflow, intelligent automation, the cloud, and more.

